Current state vs freshwater objectives: Nutrients [Nitrogen and Phosphorus]
Description
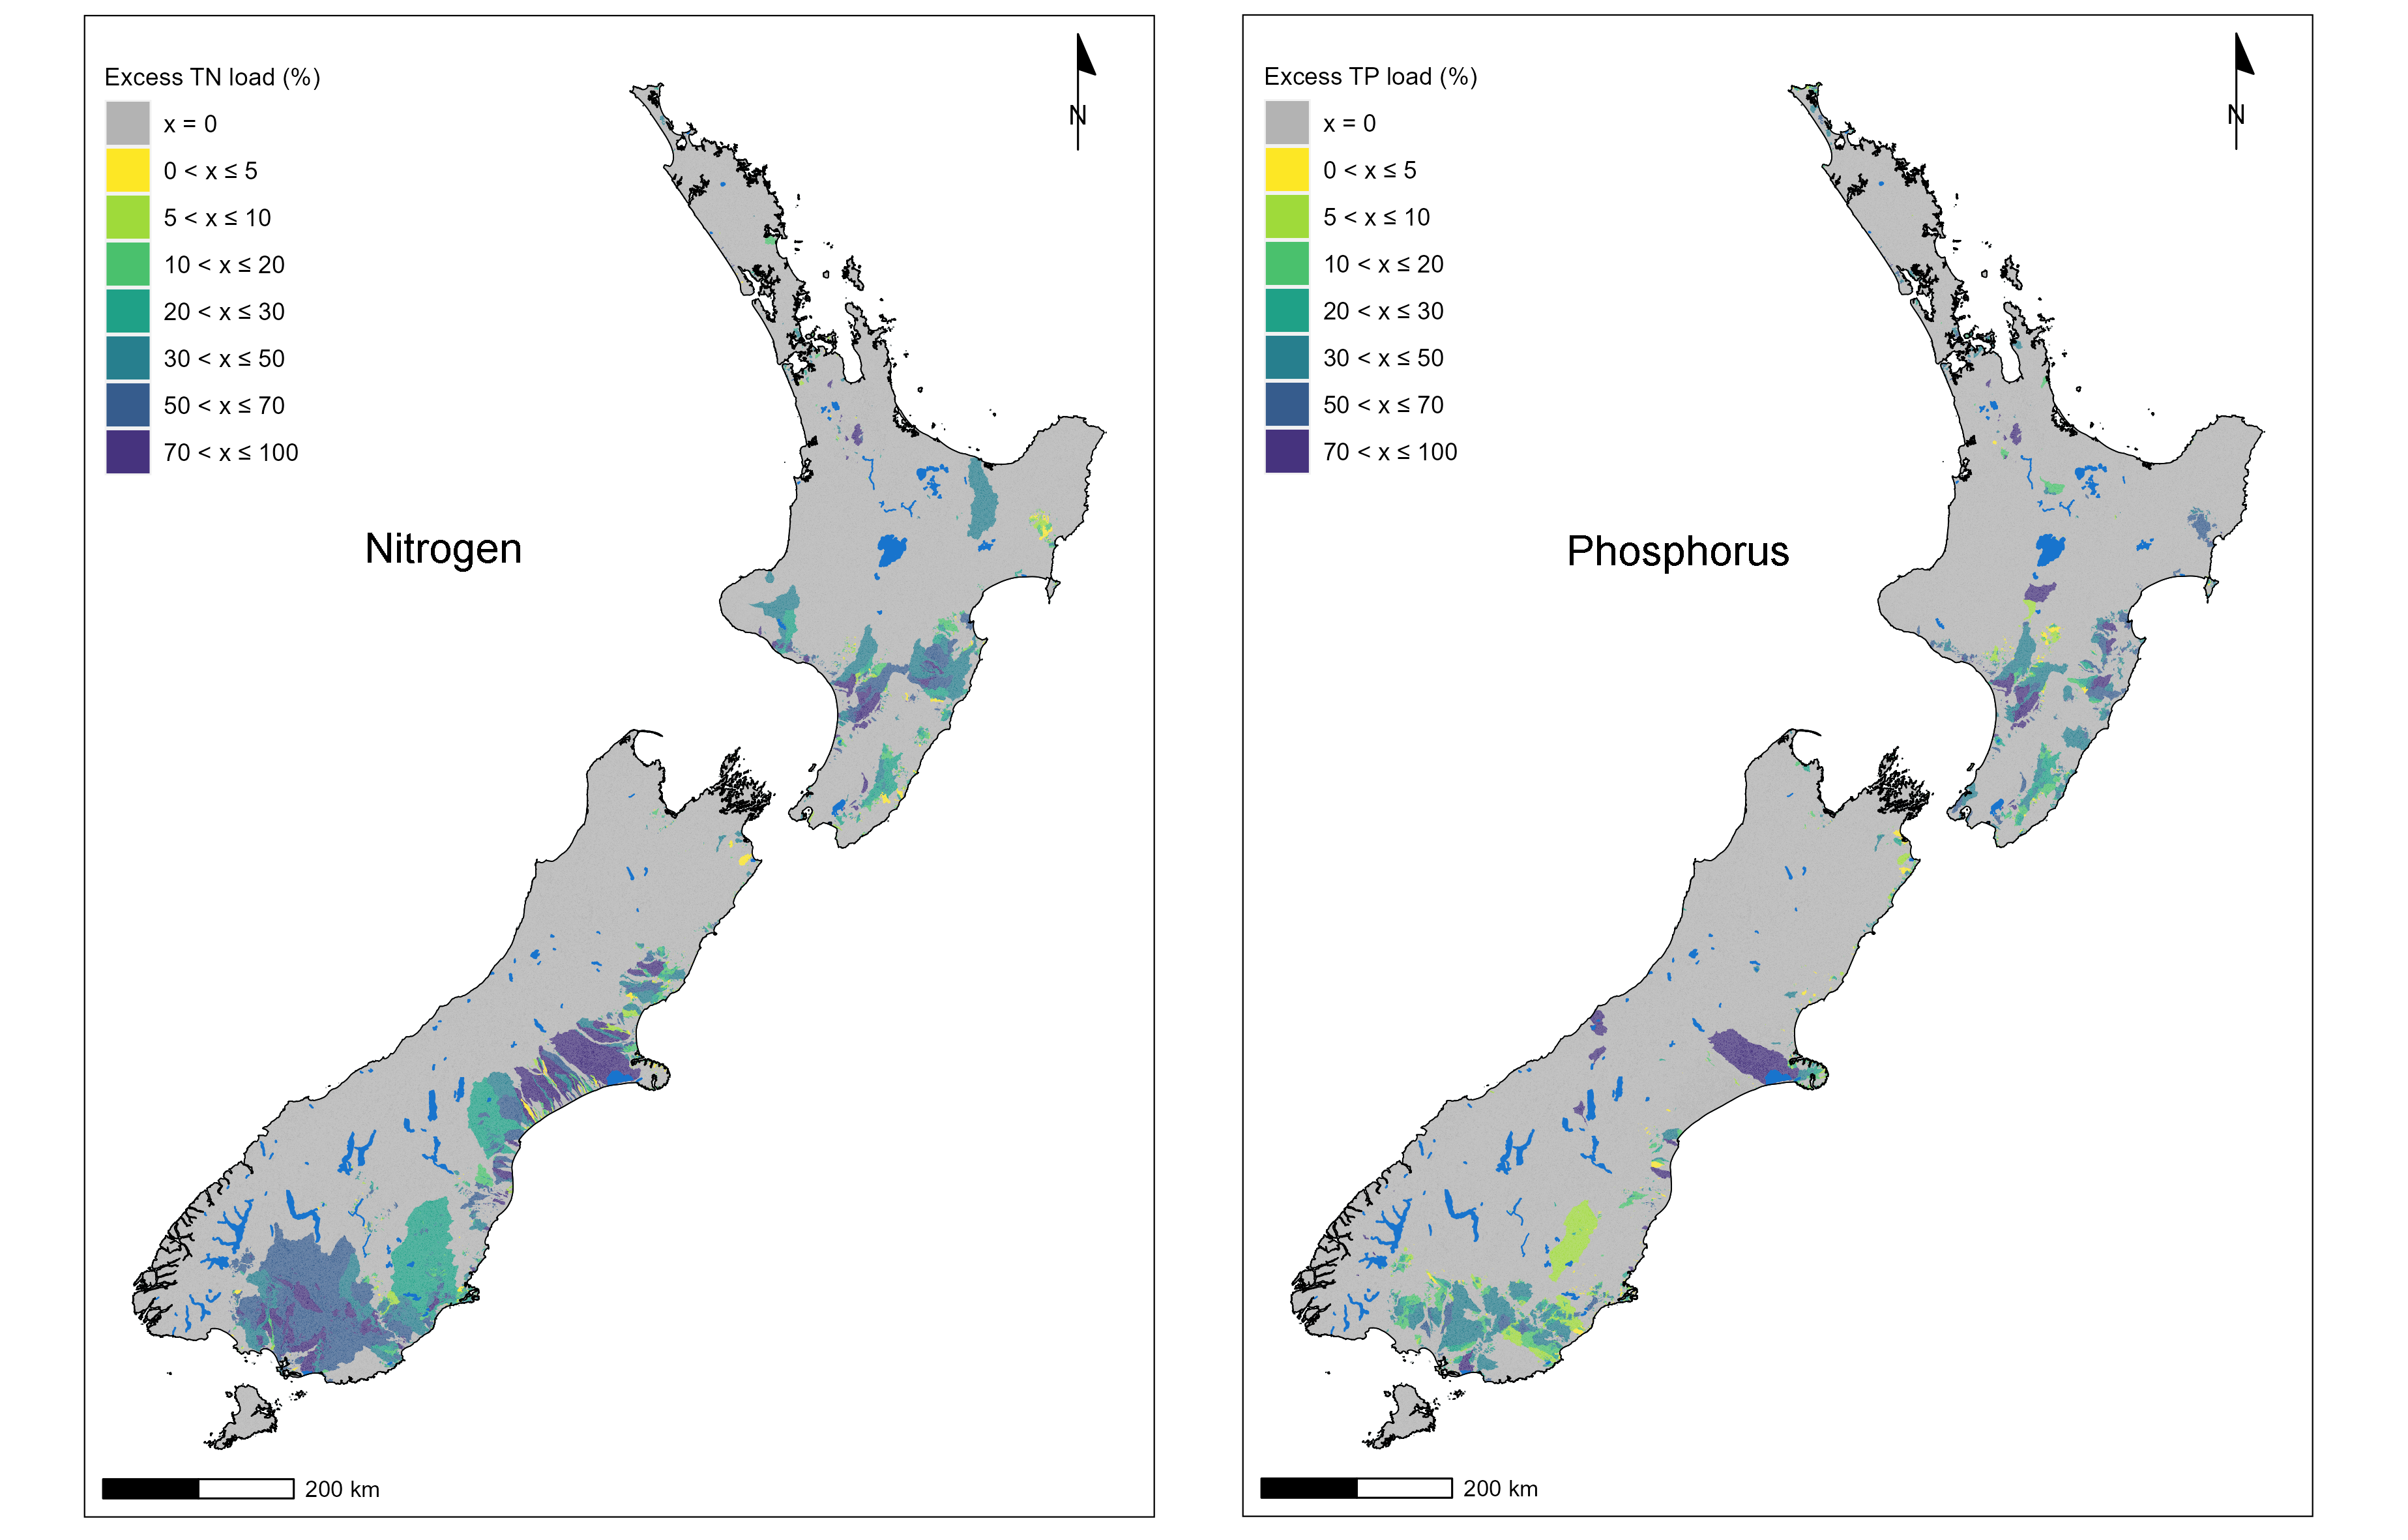
Comparison of Nutrient concentrations and loads to National Bottom Lines in New Zealand’s river, lake and estuary receiving environments.
The dataset contains the following attributes for rivers and watersheds.
Attributes for Watersheds:
- The unique DN2.4 segment identifier
- The best estimate of the excess TN load (as a yield) for the critical catchment that this watershed belongs to (kg TN/ha/year)
- The best estimate of the excess TP load (as a yield) for the critical catchment that this watershed belongs to (kg TN/ha/year)
- The best estimate of the excess TN load (as a proportion of current load) for the critical catchment that this watershed belongs to (%)
- The best estimate of the excess TP load (as a proportion of current load) for the critical catchment that this watershed belongs to (%)
- The environment type (river, lake or estuary) that is most limiting for TN and the critical catchment that this watershed belongs to
- The environment type (river, lake or estuary) that is most limiting for TP and the critical catchment that this watershed belongs to
Attributes for Riverlines:
- The unique DN2.4 segment identifier
- Current estimated median TP concentration (mg/m3) for this segment
- Current estimated median TN concentration (mg/m3) for this segment
- Current estimated median NO3N concentration (mg/m3) for this segment
- Current estimated ratio of NO3N to TN for this segment
- Current estimated TN yield (kg/ha/year) for this segment
- Current estimated TP yield (kg/ha/year) for this segment
- In river periphyton TN criteria (mg/m3) for this segment
- In river periphyton TP criteria (mg/m3) for this segment
- The probability that the current state as defined by the estimated TP concentration complies with the periphyton criteria for the NOF C-band for this segment
- The probability that the current state as defined by the estimated NO3N concentration complies with the nitrate toxicity criteria for the NOF B-band for this segment
- The probability that the current state as defined by the estimated TN concentration complies with the periphyton criteria for the NOF C-band for this segment
- The probability that the nitrate toxicity criteria is the most limiting criteria for this segment
- The best estimate of the excess TN load for this segment as kg TN/ ha/year
- The best estimate of the excess TP load for this segment as kg TN/ ha/year
Date: 25 November 2023 Version: v2
Contact: Ton Snelder, LWP Ltd
Link to report / paper
- Snelder TH, Whitehead AL, Fraser C, Larned, S, Schallenberg, M. (2020) Nitrogen loads to New Zealand aquatic receiving environments: comparison with regulatory criteria. New Zealand Journal of Marine and Freshwater Research 54:527–550
- Snelder T, Smith H, Plew D, Fraser C (2023) Nitrogen, phosphorus, sediment and Escherichia coli in New Zealand’s aquatic receiving environments: Comparison of current state to national bottom lines. LWP Ltd Report 2023-09, Christchurch, New Zealand
Our Environment
You can view the data in this dataset on a map-based web app here:
Preview Image
Dataset attributes
| Spatial extent | All NZ |
|---|---|
| Spatial resolution | Based on the digital river network used by the River Environment Classification (REC). This river network is generally consistent with 1:50,000 scale maps. |
| Temporal extent | Nominally 2016 to 2020. This 5-year period was used to esimate current nutrient related attribute states. |
| Temporal resolution | Loads are average annual. |
| Evaluation method (Validation) | Individual models were evaluated using bootstrapping or leave-one-out cross validation. |
| Evaluation result (Numeric) | Several measures were used to describe the performance of the models used to predict the current state of the nutrient attributes (i.e., the four nutrient concentrations) and to predict nutrient yields. See report for details. |
| Evaluation result (Categorical) | |
| Uncertainty method | Monte Carlo analysis was used to estimate the overall uncertainties for all segments of the river network, lakes and estuaries. |
| Uncertainty data format (Numeric) | Confidence interval of 90% confidence interval. |
| Uncertainty data format (Categorical) |
Methodology
Based on spatial statistical models and a comparison of predicted concentration to criteria defined by the NPSFM for various nutrient related attribute target states for rivers and lakes and equivalent thereof for estuaries.
Fitness for purpose / limitations
This table indicates whether the dataset is suitable for different types of questions at different scales.
Note: Users should carefully consider their purpose as this dataset may not be suitable.
| Operational | Absolute | Relative | Screening/scoping | |
|---|---|---|---|---|
| Block/farm | No | No | No | No |
| Multi-farms(5+) | No | No | No | No |
| Catchment | Maybe | Maybe | Maybe | Maybe |
| National/regional | Yes | Yes | Yes | Yes | Caveat(s) | The study has used all the available data. Therefore, it would be difficult in most catchments to improve on the analysis. However, because the models were all national in extent, there may be a degree of model bias when the results are applied at fine scales. |
Data and Resources
-
River excess yields and compliance with at least the NOF C-band attribute states pertaining to nitrogen and phosphorusSHP
License: CC BY 4.0 Date: 25 November 2023 Version: v2 Description There is...
-
Critical catchment excess yields for a target of at least the NOF C-band attribute states pertaining to nitrogen and phosphorusSHP
License: CC BY 4.0 Date: 25 November 2023 Version: v2 Description There is...
-
Nutrients RiverLines and Watershed layer attributes explanationPDF
License: CC BY 4.0 Date: 25 November 2023 Version: v2 Description This table...
-
Nitrogen&Phosphorus_CriticalCatchments_25Nov2023_PREVIEW.pngPNG
License: CC BY 4.0 Date: 25 November 2023 Version: v2 Description This is the...