Dairy heat stess under climate change
Description
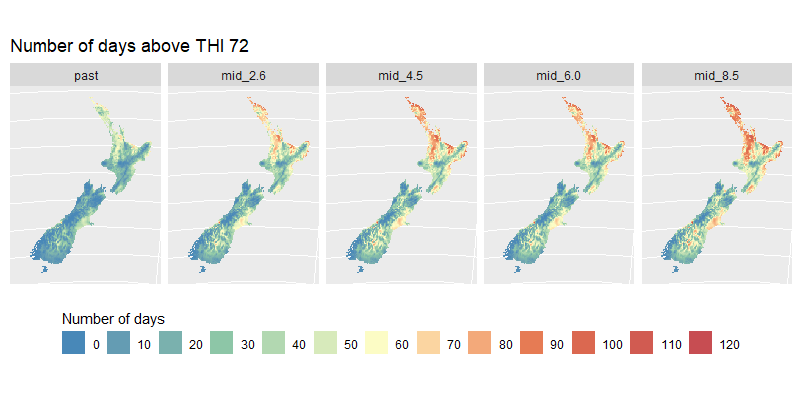
The Thermal Heat Index (THI) is a model of the level of heat stress experienced by dairy cows as described by Bryant et al (2007). This data set estimates the number of days annually (starting in July) that the THI exceeds a threshold - in this case the threshold of 72 units.
The ensemble annual means across six Global Climate Models (GCMs) are provided for:
- the historical baseline (1981-2000),
- mid-century (2041-2060) and
- end of century (2081-2100)
for four Representive Concentration Pathways (RCP) of future anthropogenic emissions.
This representation of heatstress may only be applicable to indoor animals.
Date: December 2023 Version: v1
Owner: NIWA
Contact: Dr Abha Sood, NIWA
Link to report / paper
Preview Image
Dataset attributes
| Spatial extent | New Zealand |
|---|---|
| Spatial resolution | 5km climate grid |
| Temporal extent | Three time periods: historical baseline (1981-2000), mid-century (2041-2060) and end of century (2081-2100) |
| Temporal resolution | |
| Evaluation method (Validation) | None |
| Evaluation result (Numeric) | |
| Evaluation result (Categorical) | |
| Uncertainty method | Not supplied but an estimate of uncertainty can be generated by assessing the variability of estimates between years and GCMs |
| Uncertainty data format (Numeric) | |
| Uncertainty data format (Categorical) |
Methodology
The THI as per Davis et al (2003) from Bryant et al. (2007) was applied to the NIWA VCSN, under the past and future climate scenarios from IPCC.
The annual estimates of the number of days of heat stress were averaged across the six Global Climate Models and the relevant time period (historical baseline (1981-2000), mid-century (2041-2060) and end of century (2081-2100)) for each of four Representative Concentration Pathways (RCP) of future anthropogenic emissions (2.6, 4.5, 6.0, 8.5).
Fitness for purpose / limitations
This table indicates whether the dataset is suitable for different types of questions at different scales.
Note: Users should carefully consider their purpose as this dataset may not be suitable.
| Operational | Absolute | Relative | Screening/scoping | |
|---|---|---|---|---|
| Block/farm | No | No | No | Maybe |
| Multi-farms(5+) | Maybe | Maybe | Maybe | Yes |
| Catchment | Yes | Yes | Yes | Yes |
| National/regional | Yes | Yes | Yes | Yes | Caveat(s) | The climate information is too coarse for use at finer scales. |
Data and Resources
-
THI exceeds 72 (number of days) at the historical basline (1981-2000)TIF
License: CC BY-NC 4.0 Attribute to: NIWA Description THI(72) is the number of...
-
THI exceeds 72 (number of days) at mid century (2041-2060) RCP 2.6TIF
License: CC BY-NC 4.0 Attribute to: NIWA Description THI(72) is the number of...
-
THI exceeds 72 (number of days) at mid century (2041-2060) RCP 4.5TIF
License: CC BY-NC 4.0 Attribute to: NIWA Description THI(72) is the number of...
-
THI exceeds 72 (number of days) at mid century (2041-2060) RCP 6.0TIF
License: CC BY-NC 4.0 Attribute to: NIWA Description THI(72) is the number of...
-
THI exceeds 72 (number of days) at mid century (2041-2060) RCP 8.5TIF
License: CC BY-NC 4.0 Attribute to: NIWA Description THI(72) is the number of...
-
THI exceeds 72 (number of days) at end century (2081-2100) RCP 2.6TIF
License: CC BY-NC 4.0 Attribute to: NIWA Description THI(72) is the number of...
-
THI exceeds 72 (number of days) at end century (2081-2100) RCP 4.5TIF
License: CC BY-NC 4.0 Attribute to: NIWA Description THI(72) is the number of...
-
THI exceeds 72 (number of days) at end century (2081-2100) RCP 6.0TIF
License: CC BY-NC 4.0 Attribute to: NIWA Description THI(72) is the number of...
-
THI exceeds 72 (number of days) at end century (2081-2100) RCP 8.5TIF
License: CC BY-NC 4.0 Attribute to: NIWA Description THI(72) is the number of...
-
THI72 Change by mid century PREVIEW.pngPNG
License: CC BY 4.0 Description This is the data preview image for the...