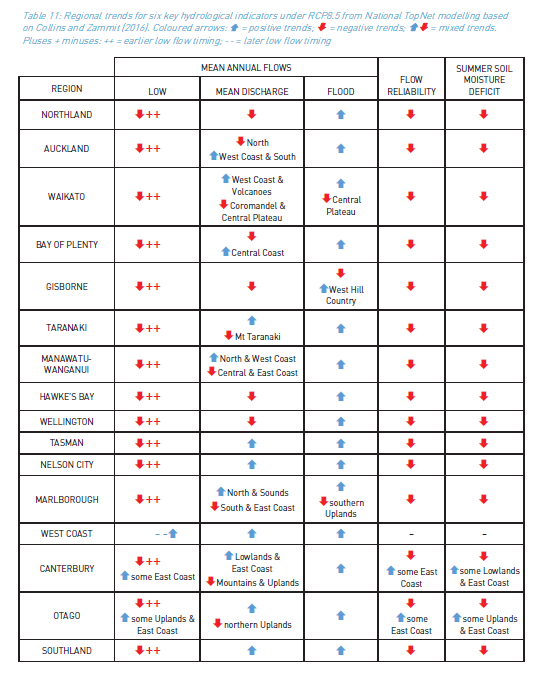
Regional trends for six key hydrological indicators under RCP8.5 (Table)
Description
The TopNet hydrological model used in this study (Clark et al. 2008) is routinely used for surface water hydrological modelling applications in New Zealand. TopNet simulates water storage in the snowpack, plant canopy, rooting zone, shallow subsurface, lakes and rivers. It produces time-series of modelled river flow throughout the modelled river network, as well as evapotranspiration, and does not consider irrigation.
Date: 2017 Version: v1
Owner: National Institute of Water & Atmospheric Research Ltd
Contact: Daniel B.G. Collins, Christian Zammit - National Institute of Water & Atmospheric Research Ltd, Chrischurch, New Zealand
Link to report / paper
Table 11 in Climate change impacts and implications for New Zealand to 2100 (Report)
Preview Image
Dataset attributes
| Spatial extent | New Zealand - Regional |
|---|---|
| Spatial resolution | |
| Temporal extent | 2100.0 |
| Temporal resolution | 2016-2100 (changes) |
| Evaluation method (Validation) | |
| Evaluation result (Numeric) | |
| Evaluation result (Categorical) | |
| Uncertainty method | |
| Uncertainty data format (Numeric) | |
| Uncertainty data format (Categorical) |
Methodology
The hydrological model used in this study is TopNet (Clark et al. 2008), which is routinely used for surface water hydrological modelling applications in New Zealand (Fig. 10). It is a spatially semi-distributed, time-stepping model of water balance. It is driven by time-series of precipitation and temperature, and of additional weather elements where available. TopNet simulates water storage in the snowpack, plant canopy, rooting zone, shallow subsurface, lakes and rivers. It produces time-series of modelled river flow (without consideration of water abstraction, impoundments or discharges) throughout the modelled river network, as well as evapotranspiration, and does not consider irrigation. TopNet has two major components: a basin module and a flow routing module.
As inputs TopNet uses the same 0.05° x 0.05° grid as the improved New Zealand climate projections (Tait et al. 2016) on a daily time step for the historic period and improved climate projections from RA1 for the period 2006–2100. For both data sets daily data were disaggregated to hourly resolution following the methods in Clark et al. (2008). https://niwa.co.nz/sites/niwa.co.nz/files/RA3-Synthesis-report.pdf, see p23
Fitness for purpose / limitations
This table indicates whether the dataset is suitable for different types of questions at different scales.
Note: Users should carefully consider their purpose as this dataset may not be suitable.
| Operational | Absolute | Relative | Screening/scoping | |
|---|---|---|---|---|
| Block/farm | No | No | No | No |
| Multi-farms(5+) | No | No | No | No |
| Catchment | No | No | No | No |
| National/regional | Yes | Yes | Yes | Maybe | Caveat(s) | -- |
Data and Resources
-
Regional trends for six key hydrological indicators under RCP8.5 (Table)PDF
License: CC BY 4.0 © All rights reserved. The copyright and all other...
-
Regional trends of hydrological indicators_PREVIEW.pngPNG
License: CC BY 4.0 Description This is the data preview image for the...