Co-benefits and trade-offs of water quality mitigation measures on greenhouse gas emissions from New Zealand dairy systems
Description
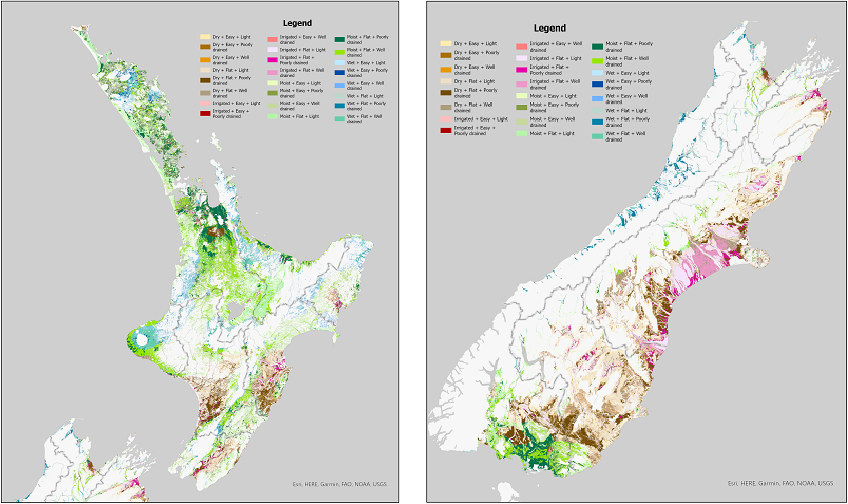
A table of dairy types and the associated co-benefits and trade-offs of mitigation measures to improve dairy farm N and P losses to water on GHG emissions from dairy systems
Date: November 2023 Version: v2
Owner: AgResearch
Contact: Tony van der Weerden (AgResearch)
Link to report / paper
Preview Image
Dataset attributes
| Spatial extent | Dairy regions of North Island and South Island of NZ |
|---|---|
| Spatial resolution | Soil data from S-map and FSL is used, Slope derived from a 15m DEM (20m contours), climate data. |
| Temporal extent | Data represents the 2019-2020 production year, based on DairyBase data. |
| Temporal resolution | percentage change to estimated annual losses |
| Evaluation method (Validation) | Expert assessment |
| Evaluation result (Numeric) | N/A |
| Evaluation result (Categorical) | N/A |
| Uncertainty method | N/A |
| Uncertainty data format (Numeric) | N/A |
| Uncertainty data format (Categorical) | N/A |
Methodology
Mitigations used to improve N and P losses to water were those previously recorded ((Monaghan et al. 2021a, b) ) as being already accepted and implemented or deemed as developing or likely to be partially or fully implemented in future (McDowell et al. 2020). Details of these are given in the link below.
An additional mitigation of removing N fertiliser from the pastoral farming system (zero N) was also included.
Mitigations were modelled by changing the appropriate management settings within Overseer for each of the farm systems within each dairy type. The change in N and P losses to water for each mitigation compared to the base file were calculated, as were the changes in GHG emissions (methane, nitrous oxide and carbon dioxide). A negative percentage value corresponds to an increase in loss while a positive value corresponds to an decrease in loss.
Methane and nitrous oxide emissions were restricted to biogenic sources (e.g. enteric methane, manure management, excreta on soils, N fertiliser) while carbon dioxide was emitted from urea fertiliser following application to land. When considering the percentage change, it is important to note the relative contributions of CO2 and N2O to total long-lived gas emissions.
Carbon dioxide emissions represent approximately 10-25% of the long-lived gas (N2O + CO2) emissions. Where a mitigation meant a lower fertiliser N input, pasture production was adjusted accordingly, using a N response of between 12 and 20 kg DM per kg N applied depending on the farm location, pasture growth rates and timing of N applications (DairyNZ 2021).
To account for lower pasture production, dairy cow numbers and hence milk production were also lowered, assuming an intake of 4500 kg DM per cow per year.
Results from the irrigation mitigation were compared with:
- base farms where irrigation application management was minimal (i.e. set depth and irrigation return period) and
- base farms where some improved irrigation management was already used via application scheduling using a water balance model (i.e. application depth adjusted to meet requirements with a fixed return period).
References:
DairyNZ 2021. Facts and Figures for NZ Dairy Farmers. DairyNZ, Hamilton
Fitness for purpose / limitations
This table indicates whether the dataset is suitable for different types of questions at different scales.
Note: Users should carefully consider their purpose as this dataset may not be suitable.
| Operational | Absolute | Relative | Screening/scoping | |
|---|---|---|---|---|
| Block/farm | No | No | No | Maybe |
| Multi-farms(5+) | No | No | No | Maybe |
| Catchment | No | No | No | Maybe |
| National/regional | Maybe | Maybe | Yes | Yes | Caveat(s) | Rainfall data used for developing dairy types is limited to three categories, which is too coarse for determining co-benefits and trade-offs at scales equivalent or smaller than catchment. The modelled output relies on the accuracy of the Overseer model for dairy systems, while the dairy management data is based on DairyBase data for the 2019-2020 production year. No data exists for dairy type 'Irrigated + Easy + Poorly Drained' (number 20) due to the absence of Dairybase data for this combination of attributes. Dairy types Irrigated + Easy + Well Drained (number 22) and Irrigated + Easy + Light (number 24) were modelled as a single type due to the relatively small areas of each; type was modelled using Well drained soil. GHG losses do not include emissions from raising youngstock. |
Data and Resources
-
Co-benefits and trade-offs of mitigation measures to improve dairy farm N and P losses to water on GHG emissions from dairy systemsXLSX
License: CC BY 4.0 Description For each dairy type, tables contain...
-
How to use this information …PDF
License: CC BY 4.0 Date: 9 November 2023 Version: v2 Description This...
-
Dairy Typology NI&SI_PREVIEW.pngPNG
License: CC BY 4.0 Description This is the data preview image for the...