National E. coli risk map
Description
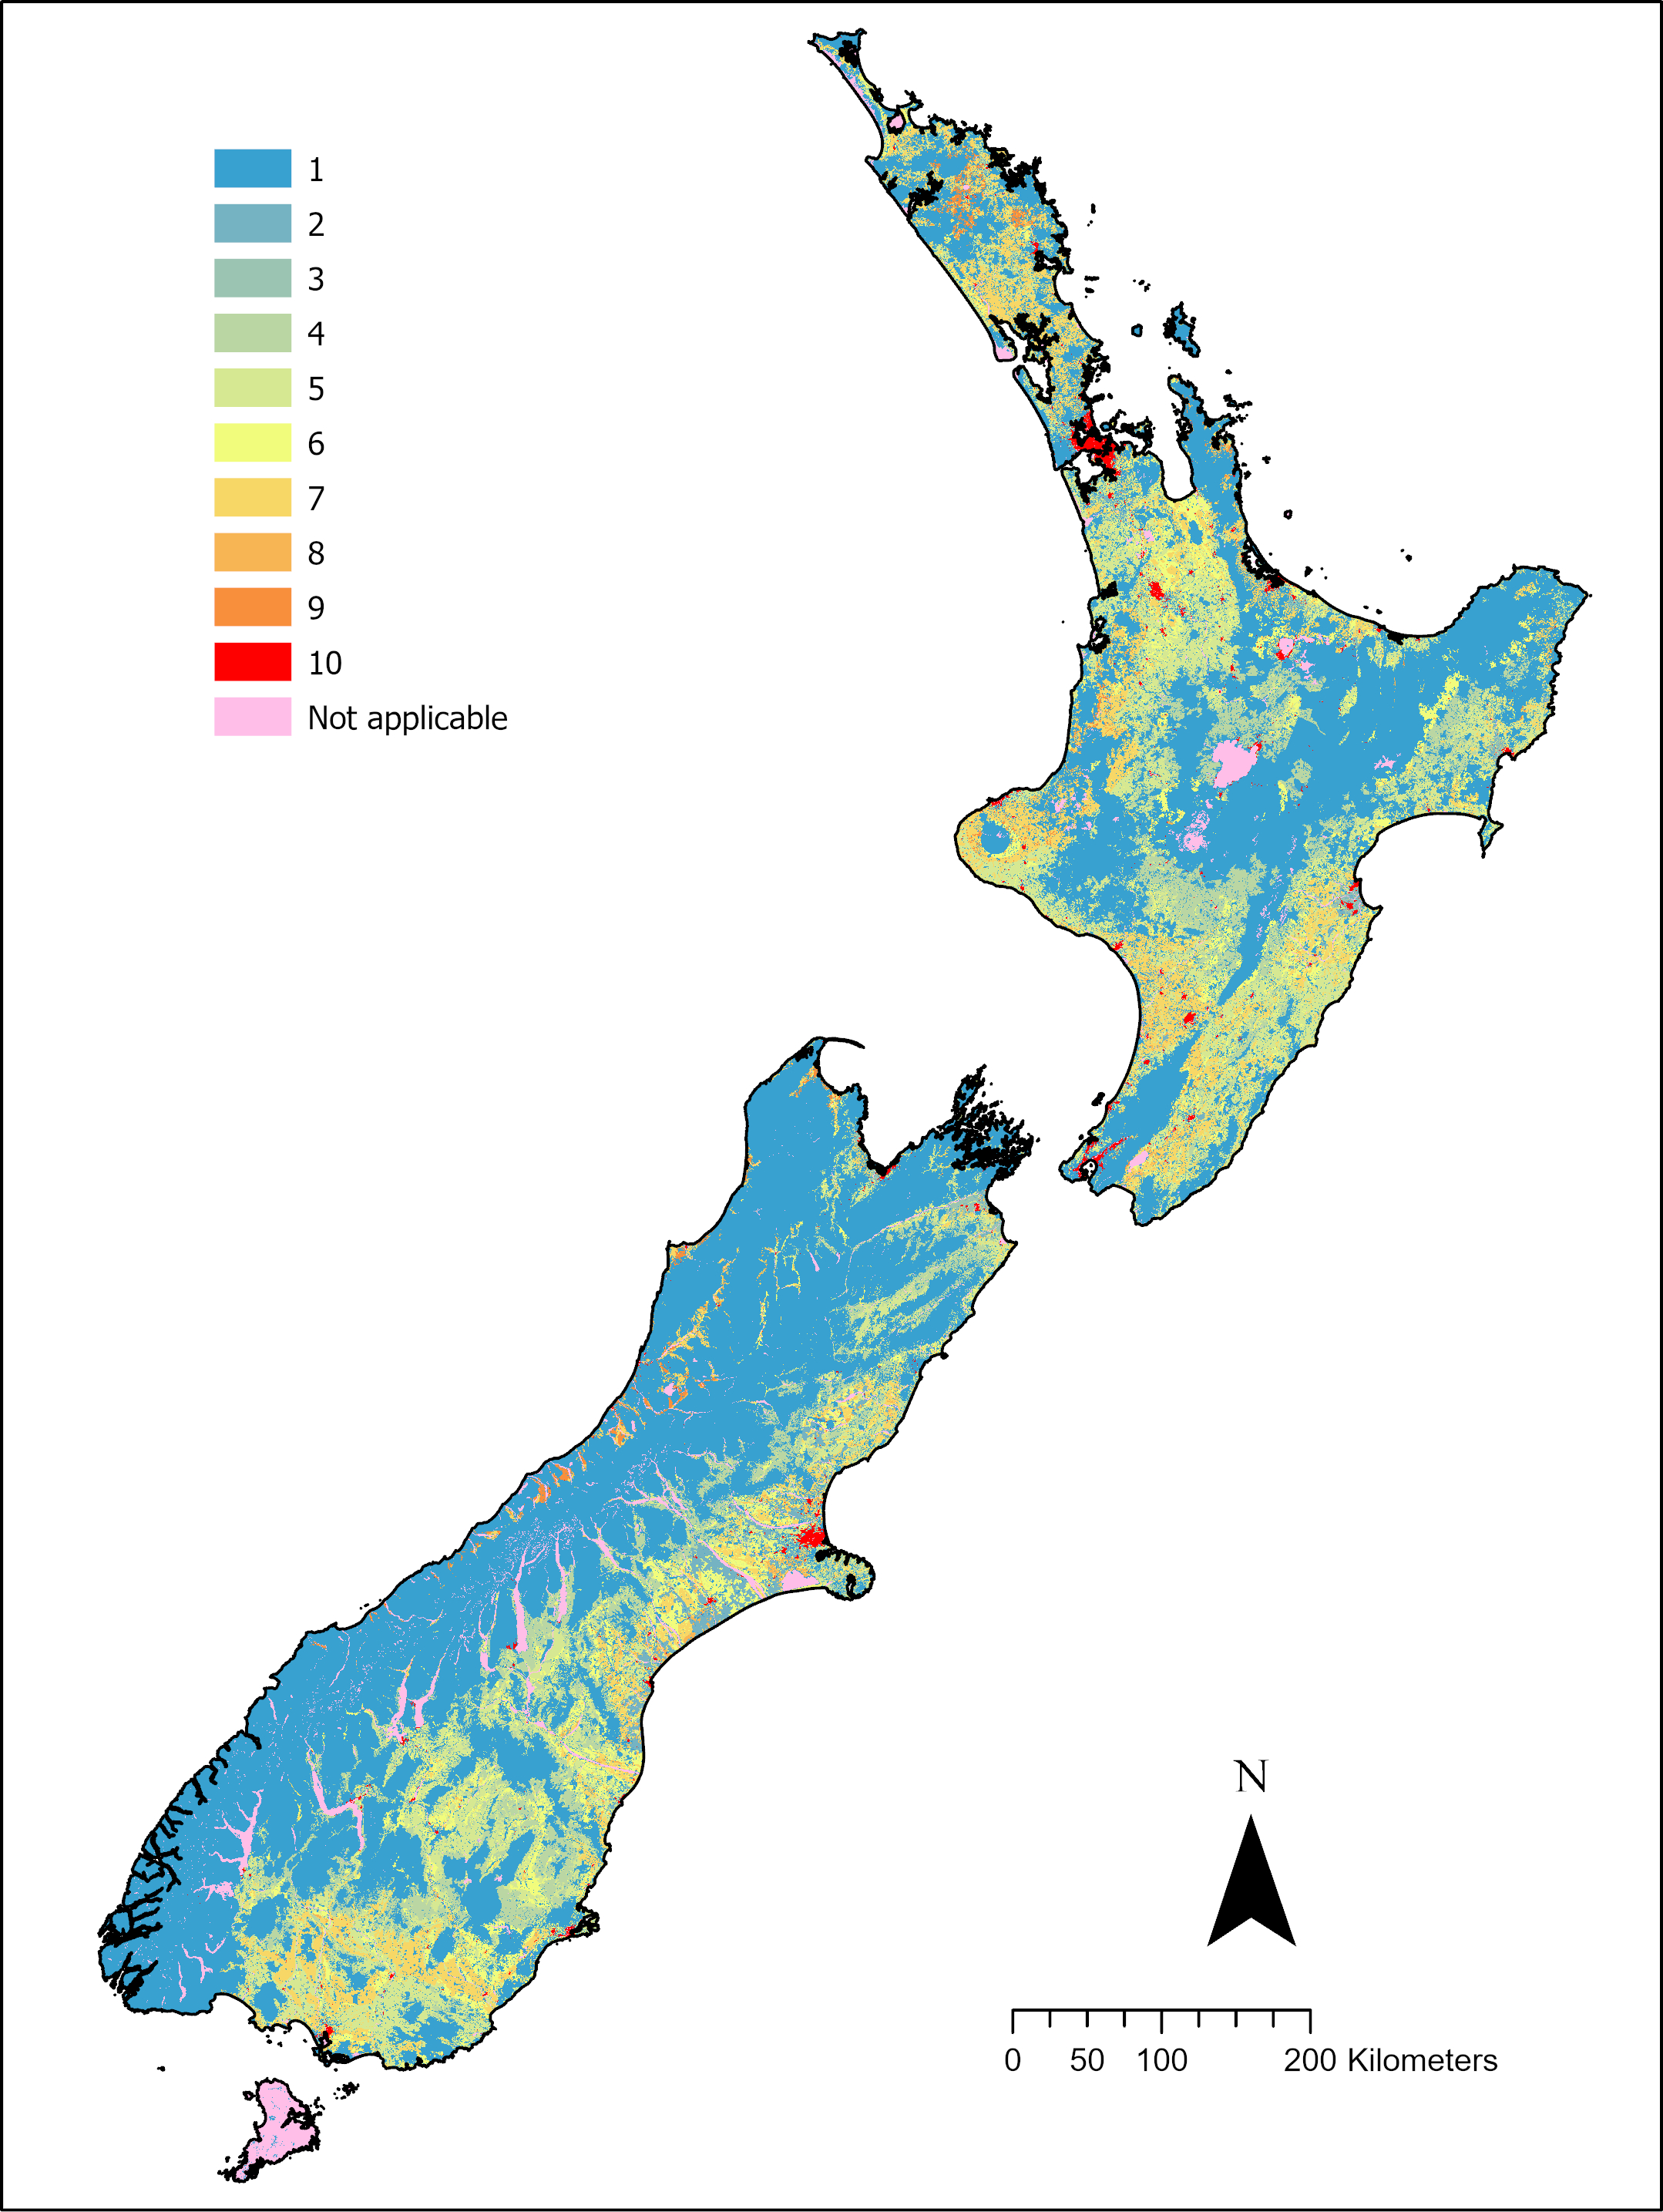
The E. coli runoff risk map maps the risk scores from the risk matrix (page 2, Table i) developed by Muirhead et al. (2023) with reference to Monaghan et al. (2021) .
Risks are ranked from 1 (lowest risk) to 10 (highest risk).
The risk scores were assigned based on expert opinion which was supported by a review of the literature on known mechanisms of microbial transport and a review of all modelling studies published in NZ. We thus use multiple lines of evidence to support the matrix.
Risk scores are applied on the basis of land cover, soils, altitude and climate.
The aim of this work was to develop a simple tool to help a regional council make decisions at a freshwater management unit (FMU) scale.
Note: The risk score map is made with “current landuse” which relates to 2018 year data. But users should be able to change land use and see the effect on the risk matrix.
Date: August 2023 Version: v1
Owner: NIWA
Contact: Richard Muirhead, Sandy Elliott, Ton Snelder, Annette Semadeni-Davies
Link to report / paper
Preview Image
Dataset attributes
| Spatial extent | National |
|---|---|
| Spatial resolution | 100m (1ha); coarsest datasets are climate normals (500m) |
| Temporal extent | N/A |
| Temporal resolution | N/A |
| Evaluation method (Validation) | None |
| Evaluation result (Numeric) | None |
| Evaluation result (Categorical) | None |
| Uncertainty method | None |
| Uncertainty data format (Numeric) | None |
| Uncertainty data format (Categorical) | None |
Methodology
The risk matrix mapping was done using a bespoke Python script that reads in pre-processed rasterised (1 ha resolution) spatial data, mostly sourced from publicly available special datasets, classifies that data into the classes used in the matrix, determines the risk score for each 1ha cell according to the matrix using raster calculations and writes out a georeferenced tiff file of the risk scores. The datasets and classes are listed below, the data sources are in the data links table.
Land use
Land use was was derived from LCDB5 and Agribase and relates to the year 2018 . There are five broad land use classes in the matrix, pasture, arable land, horticulture, urban land use and low emission land uses that includes native and exotic forestry, tussock, bare rock and ungrazed pasture.
Elevation
There are two elevation classes in the matrix, lowland (<= 350 m.a.s.l) and hill to high country (>= 350 m.a.s.l). The layer was derived from the 15 m Digital Elevation Model (DEM) grid created by the University of Otago upscaled to 1ha resolution.
Wetness
Wetness is an index derived from three data sets, irrigated land, rainfall and potential evapotranspiration (PET).
Irrigated land was taken from the MfE 2017 irrigation shapefile, this is a Boolean dataset where a value of 1 represents irrigated land and a value of 0 no irrigation. The shapefile was rasterised for mapping.
Mean annual Rainfall and PET were taken from the NIWA’s climate normal grids (1991-2020). The unit for both datasets is mm depth. The grids have a 500m resolution and were downscaled to 1 ha.
The wetness index is assigned as follows:
| Irrigated | all irrigated land |
| Wet | non-irrigated land with a mean annual rainfall <= 1700 m |
| Dry | non-irrigated land with a mean annual rainfall < 1700 m where the effective rainfall (rain – PET) < 1100 mm |
| Moist | non-irrigated land with a mean annual rainfall < 1700 m where the effective rainfall <= 1100 mm |
Drainage
The matrix drainage index was derived from two datasets from the Land Resources Inventory (LRI; Newsome et al. 2008) Fundamental Soil Layer : soil drainage class and 60 mm Profile Available Water (PAW). Both data sets are provided as shapefiles and were rasterised for the matrix mapping.
The matrix drainage index is assigned as follows:
| Light | anywhere the PAW at 60cm < 83mm, approximated as PAW classes 5 and 6 (low to very low) |
| Poor | anywhere with a PAW >=83 that has a drainage class of 1, 2 or 3 (very poor to imperfect drainage) |
| Well | anywhere with a PAW >=83 that has a drainage class of 4 or 5 (good to well drained) |
Note: with the exception of urban areas, areas with no data in the FSL layer (e.g., quarries, lakes) are classed as low risk.
Fitness for purpose / limitations
This table indicates whether the dataset is suitable for different types of questions at different scales.
Note: Users should carefully consider their purpose as this dataset may not be suitable.
| Operational | Absolute | Relative | Screening/scoping | |
|---|---|---|---|---|
| Block/farm | No | No | No | Maybe |
| Multi-farms(5+) | No | No | Maybe | Yes |
| Catchment | No | No | Yes | Yes |
| National/regional | No | No | Yes | Yes | Caveat(s) | The outputs are based predominantly on expert opnion. Landuses across the country are lumped into 5 large classes. |
Data and Resources
-
National E. coli risk mapTIF
License: CC BY 4.0 Description Georeferenced tif file (1 ha resolution)...
-
E. coli risk matrix (Report)PDF
License: CC BY 4.0 Description Development of an E. coli runoff risk matrix...
-
E. coli risk matrix map_PREVIEW.jpgJPEG
License: CC BY 4.0 Description This is the data preview image for the...